How to Build Dashboards for Your Business
Unlock the power of data with our step-by-step guide on building dashboards for your business. Learn essential strategies, tools, and tips to create dashboards that deliver actionable insights and support smarter decision-making.
16
Jun
How to Build Dashboards for Your Business
Table of Contents
In today’s fast-paced business environment, making data-driven decisions is essential for success. Business dashboard tools help companies visualize the most important information, track their progress, and make better decisions more quickly. We know that using data helps us grow here at BM Infotrade Pvt. Ltd. The article shows you how to make good data dashboards, using tools like Power BI, business analytics in real time, and some helpful tips for designing impactful dashboards.
What Are Business Dashboards?
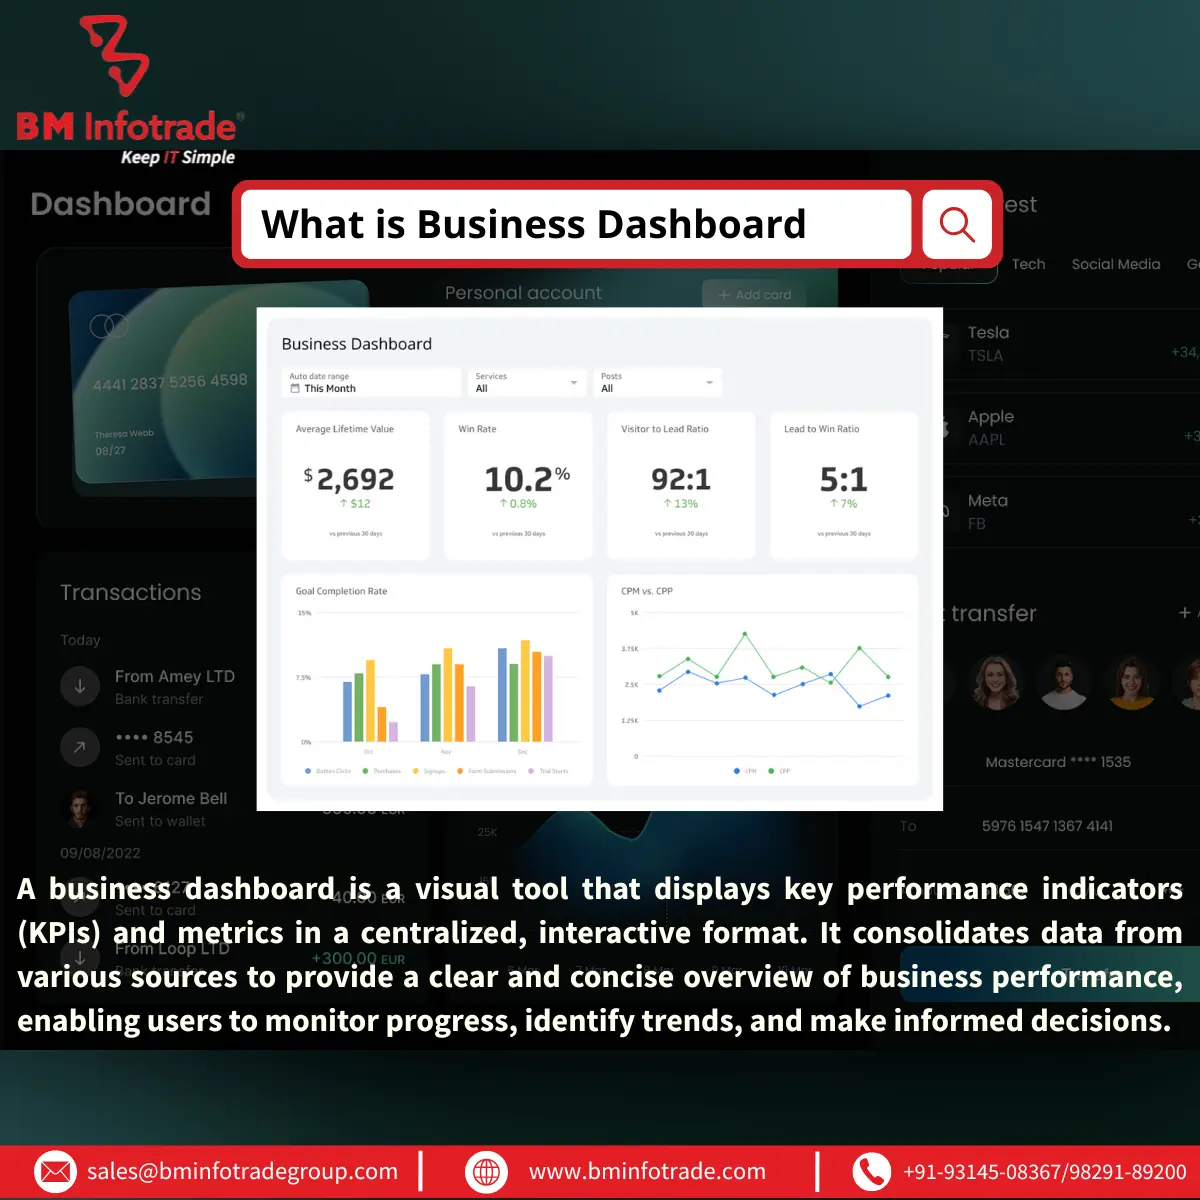
A business dashboard gathers and displays the most important information and statistics all in one easy-to-understand place. With the help of dashboards, businesses are able to keep an eye on their work, find patterns, and choose the best course of action fast. Whatever metrics you’re interested in, such as sales, customer involvement, or efficiency, dashboards bring all the information together, giving you a quick overview of your business. We at BM Infotrade Pvt. Ltd. stress how important dashboards are in changing raw data into practical insights. Businesses can make better use of their KPI tracking dashboards to meet their goals and react to changes as they happen.
Choosing the Right Business Dashboard Tools
Selecting the appropriate tools is the first step in how to build data dashboards. Businesses of any size can benefit from the strong features offered by Power BI, Tableau, and Google Data Studio. For instance, many organizations like Power BI for its uncomplicated interface and easy integration with Microsoft’s tools. If looking for inexpensive ways to manage data, you can use the free dashboard templates on Google Data Studio or Excel. Using these templates, companies can develop custom dashboards that respond to their requirements without beginning the process from the very beginning. When choosing a tool at BM Info Trade Pvt. Ltd., we urge you to review your data volume, the complexity of your data, and how well integration will work. Should real-time business analytics be your goal, you can rely on dashboards created with Power BI or Tableau, which are designed to automatically update your data.
Step-by-Step Guide to Building a Data Dashboard
1. Define Your Objectives and KPIs
Before diving into dashboard design best practices, clarify the purpose of your dashboard. Monitoring sales progress, the whole experience your customers have and the way operations are managed? Figuring out the KPIs that reflect your business goals is important. KPI tracking dashboards should focus on metrics that matter most to your organization, such as revenue growth, customer retention rates, or inventory turnover.
2. Gather and Prepare Your Data
Any dashboard is built around data. Data can be made correct when it is gathered by using either CRM, specialized financial software, or third-party APIs. With the help of APIs, dashboards can become more effective by sourcing fresh data from different outside systems, like social networks and e-stores. It is important to keep your data neat, correct, and arranged to avoid being tricked.
3. Choose the Right Visualization Techniques
Effective dashboard visualization techniques make complex data accessible. Make your data clear by using charts, graphs, and gauges.
For example:
- Bar graphs for checking how sales differ in different regions.
- Line graphs are used to follow the trend of your data as time goes on.
- Showing a share of the market, such as the one in a pie chart, is common.
Too many visuals will make your dashboard cluttered, so avoid this. Stick to dashboard design best practices by prioritizing simplicity and clarity. Our company believes in creating designs that are both clean and easy to read, so users can quickly understand the information.
4. Leverage Power BI Dashboard Tutorial Resources
If Power BI is new to you, online tutorials will lead you through the process of designing dashboards. Most Power BI dashboard tutorials will teach you how to:
- Linking to different data sources.
- Creating visualizations like charts and tables.
- Creating business analytics that can update in real time.
Microsoft’s official material and forums are useful for anyone getting started with Power BI, as well as for people with more experience. With these tutorials, you can become skilled at making custom dashboards and solving problems for your business.
5. Test and Refine Your Dashboard
When your dashboard is ready, let users try it out to check that it meets their wishes. Obtain reviews for each application’s layout, correctness of data, and aesthetics. Enhance your site’s usability by using users’ feedback to revise the design. For instance, if users find certain visuals confusing, adjust your dashboard visualization techniques to make them more intuitive.
6. Implement and Monitor
Roll out your dashboard and check that it works smoothly with your usual company workflows. Keep an eye on your performance in real time with business analytics. Go over your KPI dashboards now and then to match them with recent changes in your business.
Also Read:- Microsoft Power BI: Top features and advantages
Dashboard Design Best Practices
To maximize the effectiveness of your dashboards, follow these dashboard design best practices:
- Keep it Simple: Use just a few important metrics to avoid confusing your users.
- Maintain the same colors, fonts, and appearance so your brand appears uniform.
- Enable users to interact with the data by either filtering results or looking closely at individual metrics.
- Design your dashboard to look good and function on every device.
- Use real-time data to keep your data up-to-date as often as possible.
We aim to make our dashboards both easy to use and attractive, so they provide value to our stakeholders.
Benefits of Custom Dashboard Development
While free dashboard templates help, making a custom dashboard gives you more flexibility. With a custom dashboard, you can:
- Make sure every visual you use matches your brand’s style.
- Add original data sources to your dashboards using API integration.
- Focus on niche KPIs specific to your industry.
A salesperson could create a custom application to manage inventory, while those in the marketing team might keep an eye on statistics on social media. Customization allows your dashboard to work best for your business.
Conclusion
Effective dashboard building can greatly improve how a business grows using its data. By leveraging business dashboard tools like Power BI, following dashboard design best practices, and incorporating real-time business analytics, you can create dashboards that drive actionable insights. Clarity, relevance, and ease of use should always be the main concerns, no matter if you start with free templates or use custom dashboard development.
We at BM Infotrade Pvt. Ltd. believe that carefully designed KPI dashboards help businesses decide smarter and keep them a step ahead of the pack. Begin with basic dashboards, learn new visualization methods, and increase their size as your business becomes bigger.
FAQs
1. What are the best tools for building data dashboards?
Many people use Power BI, Tableau, and Google Data Studio for creating business dashboards since they are both powerful and easy to use.
2. How can I ensure my dashboard is user-friendly?
Excellent dashboard design includes keeping the look simple, applying similar designs, and placing priority on interaction.
3. Can I use free dashboard templates for my business?
If you want to start with simple business dashboards, free examples from Google Data Studio or Excel can help.
4. What is the benefit of real-time business analytics in dashboards?
Up-to-date data from business analytics guarantees businesses can respond right away to shifts and act wisely.
5. How do I integrate APIs into dashboards?
By connecting your dashboard tool to external resources, APIs allow you to bring in data on a regular basis, which better supports the dashboard’s function and accuracy.


Anshul Goyal
Group BDM at B M Infotrade | 11+ years Experience | Business Consultancy | Providing solutions in Cyber Security, Data Analytics, Cloud Computing, Digitization, Data and AI | IT Sales Leader